Chapter 7: Statistical Analysis
Goals:
Apply simple statistic to the synthetic data.
• Descriptive statistics: mean, median, mode.
• Hypothesis testing (t-tests, ANOVA).
• Correlation and regression.
Descriptive statistics
As the name suggests, in descriptive stats you can observe and describe the features of the exact data that you collected. You can quickly check some stats like mean, standard deviation (SD) and standard error (SE), median and 1st and 3rd quartile.
Code
SE <- function(x){sd(x)/sqrt(length(x))}
data %>%
mutate(percent_CD4 = 100*CD4/CD3)%>%
group_by(group) %>%
summarise(mean = mean(percent_CD4),
sd = sd(percent_CD4),
se = SE(percent_CD4),
min = min(percent_CD4),
quantile_25 = quantile(percent_CD4, probs = 0.25),
median = median(percent_CD4),
quantile_75 = quantile(percent_CD4, probs = 0.75),
max = max(percent_CD4)) %>%
print()
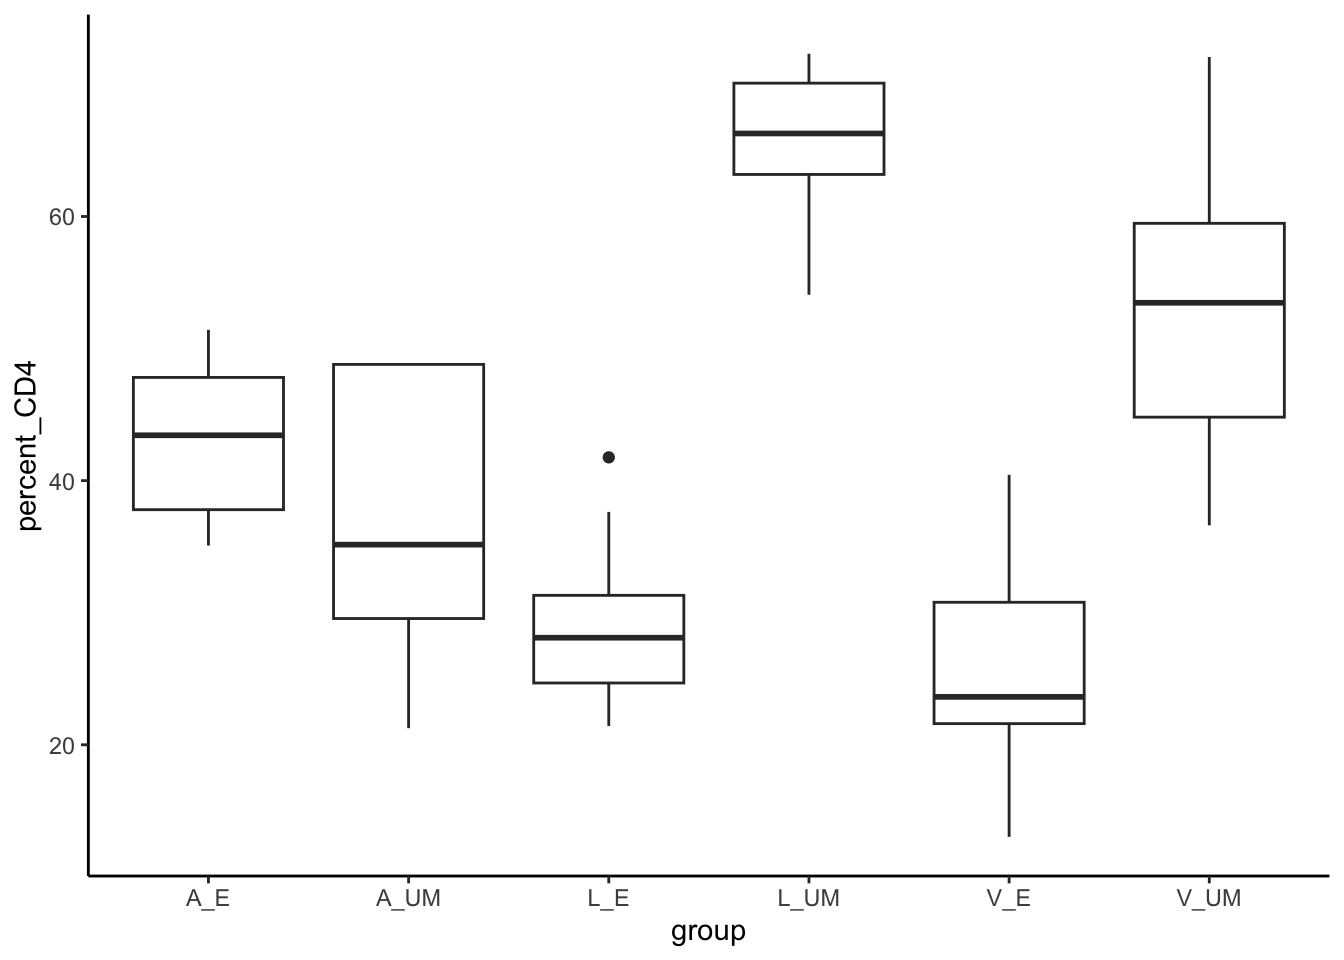
data %>%
mutate(percent_CD4 = 100*CD4/CD3)%>%
ggplot(aes(group, percent_CD4))+geom_boxplot()+
theme_classic()