Chapter 6: Data Visualisation with ggplot2 2
Goals:
Learn additional visualisation techniques.
• Adjusting theme elements
• Annotating the plots
• facet_wrap() and grid_plot()
• Savings plots
Adjusting theme elements
Everything in ggplot can be adjusted. Lets just go through a few of them to show you how its done, and you can explore them as you go.
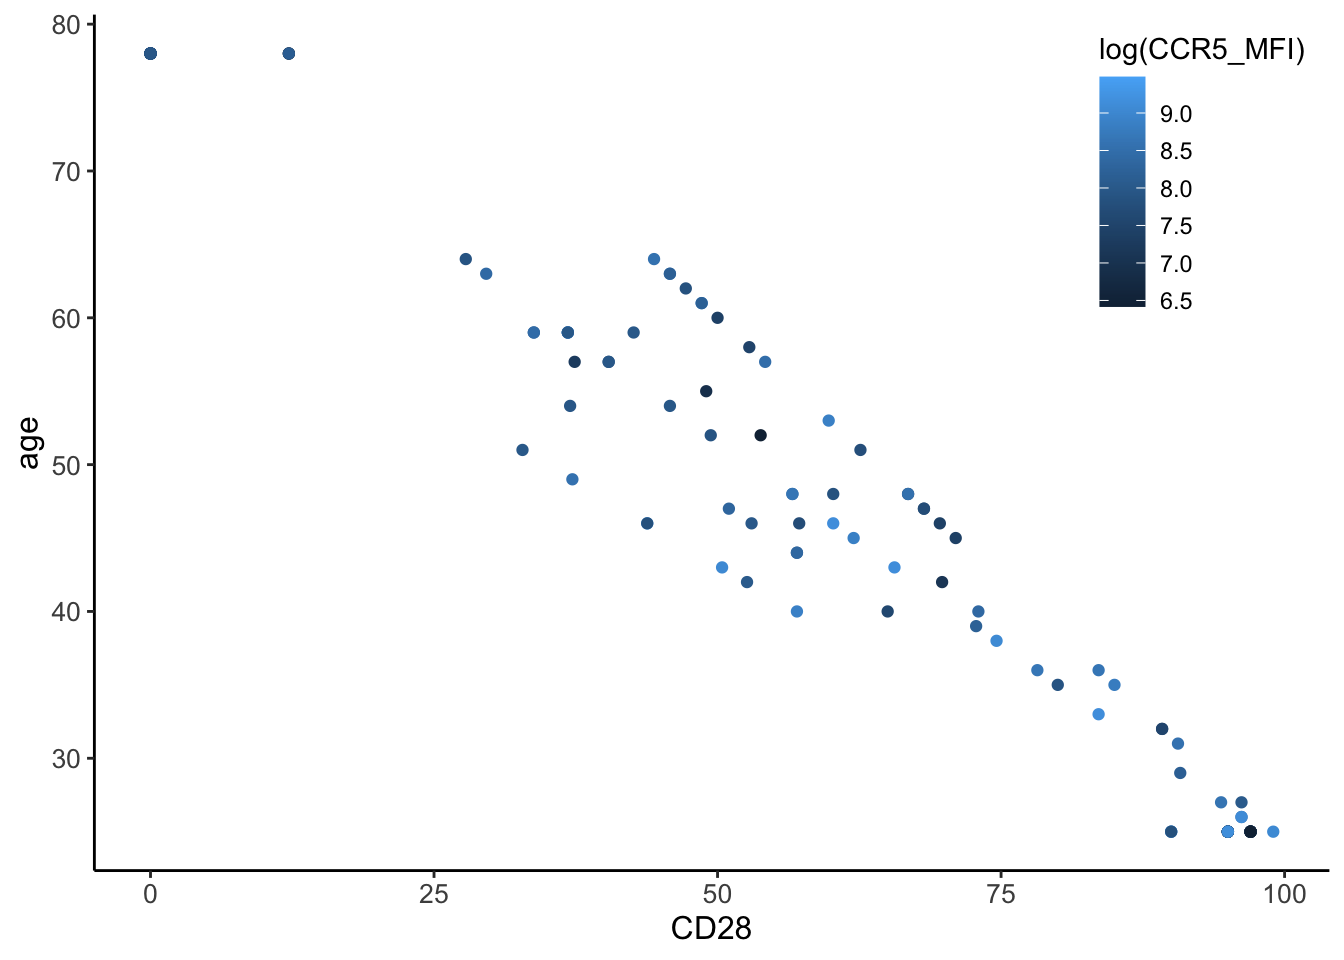
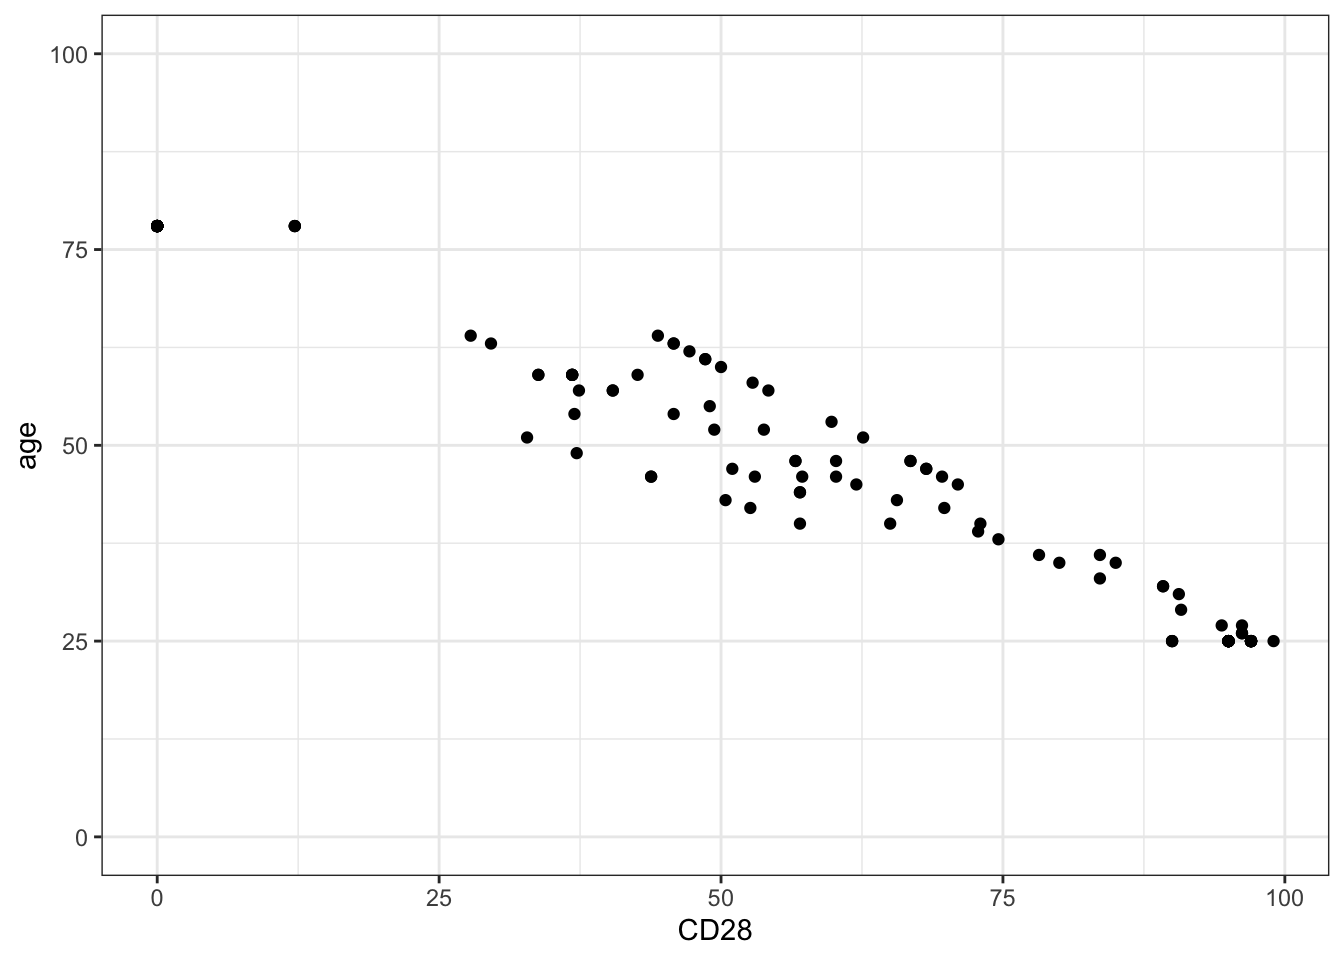
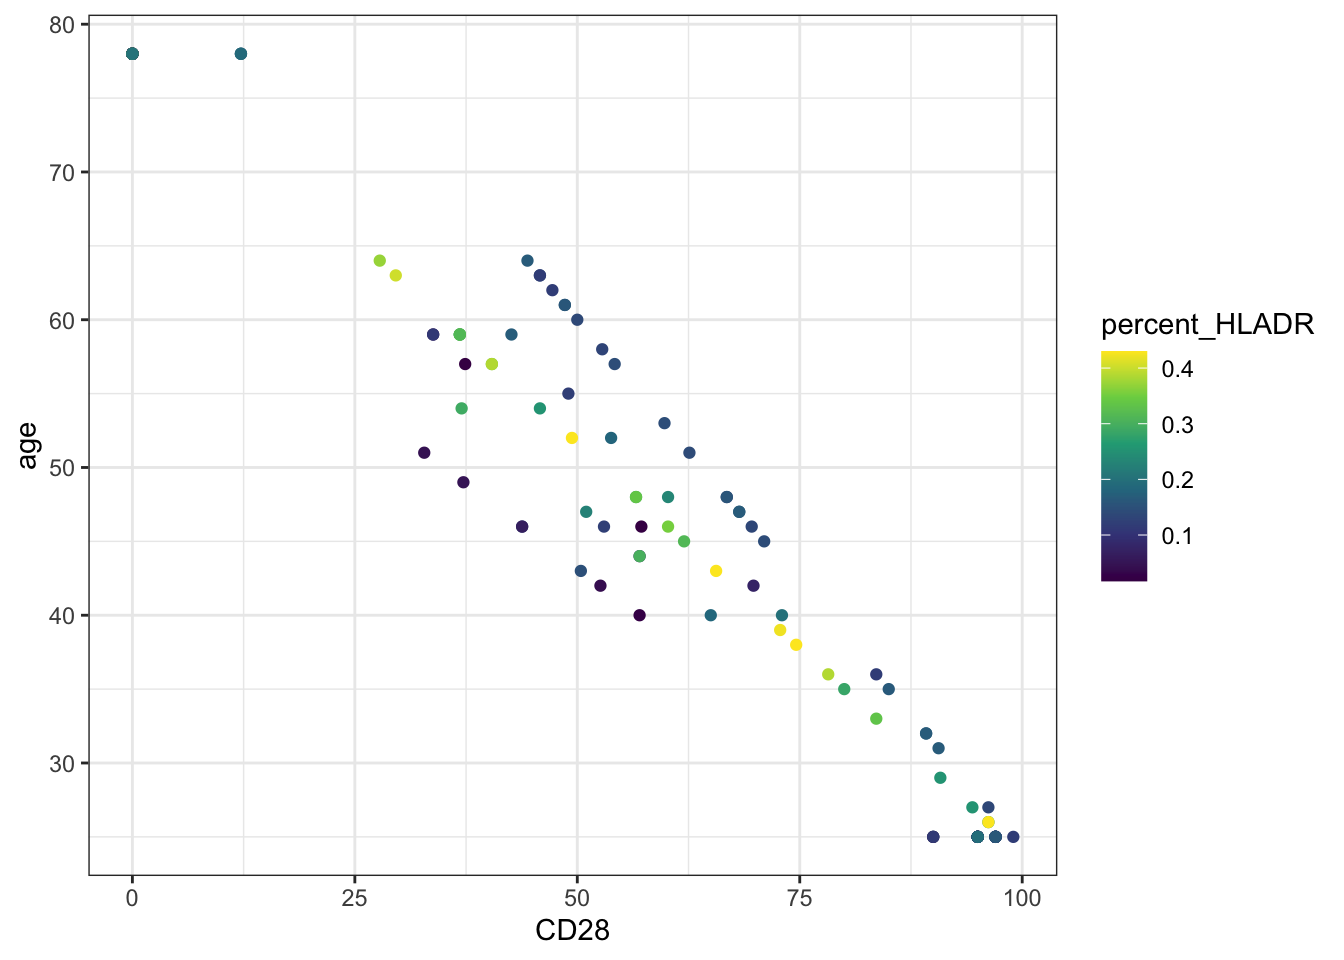
Theme elements:
Code
Changing the colours manually:
Code
## List of 136
##  $ line                            :List of 6
##   ..$ colour       : chr "black"
##   ..$ linewidth    : num 0.5
##   ..$ linetype     : num 1
##   ..$ lineend      : chr "butt"
##   ..$ arrow        : logi FALSE
##   ..$ inherit.blank: logi TRUE
##   ..- attr(*, "class")= chr [1:2] "element_line" "element"
##  $ rect                            :List of 5
##   ..$ fill         : chr "white"
##   ..$ colour       : chr "black"
##   ..$ linewidth    : num 0.5
##   ..$ linetype     : num 1
##   ..$ inherit.blank: logi TRUE
##   ..- attr(*, "class")= chr [1:2] "element_rect" "element"
##  $ text                            :List of 11
##   ..$ family       : chr ""
##   ..$ face         : chr "plain"
##   ..$ colour       : chr "black"
##   ..$ size         : num 11
##   ..$ hjust        : num 0.5
##   ..$ vjust        : num 0.5
##   ..$ angle        : num 0
##   ..$ lineheight   : num 0.9
##   ..$ margin       : 'margin' num [1:4] 0points 0points 0points 0points
##   .. ..- attr(*, "unit")= int 8
##   ..$ debug        : logi FALSE
##   ..$ inherit.blank: logi TRUE
##   ..- attr(*, "class")= chr [1:2] "element_text" "element"
##  $ title                           : NULL
##  $ aspect.ratio                    : NULL
##  $ axis.title                      : NULL
##  $ axis.title.x                    :List of 11
##   ..$ family       : NULL
##   ..$ face         : NULL
##   ..$ colour       : NULL
##   ..$ size         : NULL
##   ..$ hjust        : NULL
##   ..$ vjust        : num 1
##   ..$ angle        : NULL
##   ..$ lineheight   : NULL
##   ..$ margin       : 'margin' num [1:4] 2.75points 0points 0points 0points
##   .. ..- attr(*, "unit")= int 8
##   ..$ debug        : NULL
##   ..$ inherit.blank: logi TRUE
##   ..- attr(*, "class")= chr [1:2] "element_text" "element"
##  $ axis.title.x.top                :List of 11
##   ..$ family       : NULL
##   ..$ face         : NULL
##   ..$ colour       : NULL
##   ..$ size         : NULL
##   ..$ hjust        : NULL
##   ..$ vjust        : num 0
##   ..$ angle        : NULL
##   ..$ lineheight   : NULL
##   ..$ margin       : 'margin' num [1:4] 0points 0points 2.75points 0points
##   .. ..- attr(*, "unit")= int 8
##   ..$ debug        : NULL
##   ..$ inherit.blank: logi TRUE
##   ..- attr(*, "class")= chr [1:2] "element_text" "element"
##  $ axis.title.x.bottom             : NULL
##  $ axis.title.y                    :List of 11
##   ..$ family       : NULL
##   ..$ face         : NULL
##   ..$ colour       : NULL
##   ..$ size         : NULL
##   ..$ hjust        : NULL
##   ..$ vjust        : num 1
##   ..$ angle        : num 90
##   ..$ lineheight   : NULL
##   ..$ margin       : 'margin' num [1:4] 0points 2.75points 0points 0points
##   .. ..- attr(*, "unit")= int 8
##   ..$ debug        : NULL
##   ..$ inherit.blank: logi TRUE
##   ..- attr(*, "class")= chr [1:2] "element_text" "element"
##  $ axis.title.y.left               : NULL
##  $ axis.title.y.right              :List of 11
##   ..$ family       : NULL
##   ..$ face         : NULL
##   ..$ colour       : NULL
##   ..$ size         : NULL
##   ..$ hjust        : NULL
##   ..$ vjust        : num 1
##   ..$ angle        : num -90
##   ..$ lineheight   : NULL
##   ..$ margin       : 'margin' num [1:4] 0points 0points 0points 2.75points
##   .. ..- attr(*, "unit")= int 8
##   ..$ debug        : NULL
##   ..$ inherit.blank: logi TRUE
##   ..- attr(*, "class")= chr [1:2] "element_text" "element"
##  $ axis.text                       :List of 11
##   ..$ family       : NULL
##   ..$ face         : NULL
##   ..$ colour       : chr "grey30"
##   ..$ size         : 'rel' num 0.8
##   ..$ hjust        : NULL
##   ..$ vjust        : NULL
##   ..$ angle        : NULL
##   ..$ lineheight   : NULL
##   ..$ margin       : NULL
##   ..$ debug        : NULL
##   ..$ inherit.blank: logi TRUE
##   ..- attr(*, "class")= chr [1:2] "element_text" "element"
##  $ axis.text.x                     :List of 11
##   ..$ family       : NULL
##   ..$ face         : NULL
##   ..$ colour       : NULL
##   ..$ size         : NULL
##   ..$ hjust        : NULL
##   ..$ vjust        : num 1
##   ..$ angle        : NULL
##   ..$ lineheight   : NULL
##   ..$ margin       : 'margin' num [1:4] 2.2points 0points 0points 0points
##   .. ..- attr(*, "unit")= int 8
##   ..$ debug        : NULL
##   ..$ inherit.blank: logi TRUE
##   ..- attr(*, "class")= chr [1:2] "element_text" "element"
##  $ axis.text.x.top                 :List of 11
##   ..$ family       : NULL
##   ..$ face         : NULL
##   ..$ colour       : NULL
##   ..$ size         : NULL
##   ..$ hjust        : NULL
##   ..$ vjust        : num 0
##   ..$ angle        : NULL
##   ..$ lineheight   : NULL
##   ..$ margin       : 'margin' num [1:4] 0points 0points 2.2points 0points
##   .. ..- attr(*, "unit")= int 8
##   ..$ debug        : NULL
##   ..$ inherit.blank: logi TRUE
##   ..- attr(*, "class")= chr [1:2] "element_text" "element"
##  $ axis.text.x.bottom              : NULL
##  $ axis.text.y                     :List of 11
##   ..$ family       : NULL
##   ..$ face         : NULL
##   ..$ colour       : NULL
##   ..$ size         : NULL
##   ..$ hjust        : num 1
##   ..$ vjust        : NULL
##   ..$ angle        : NULL
##   ..$ lineheight   : NULL
##   ..$ margin       : 'margin' num [1:4] 0points 2.2points 0points 0points
##   .. ..- attr(*, "unit")= int 8
##   ..$ debug        : NULL
##   ..$ inherit.blank: logi TRUE
##   ..- attr(*, "class")= chr [1:2] "element_text" "element"
##  $ axis.text.y.left                : NULL
##  $ axis.text.y.right               :List of 11
##   ..$ family       : NULL
##   ..$ face         : NULL
##   ..$ colour       : NULL
##   ..$ size         : NULL
##   ..$ hjust        : num 0
##   ..$ vjust        : NULL
##   ..$ angle        : NULL
##   ..$ lineheight   : NULL
##   ..$ margin       : 'margin' num [1:4] 0points 0points 0points 2.2points
##   .. ..- attr(*, "unit")= int 8
##   ..$ debug        : NULL
##   ..$ inherit.blank: logi TRUE
##   ..- attr(*, "class")= chr [1:2] "element_text" "element"
##  $ axis.text.theta                 : NULL
##  $ axis.text.r                     :List of 11
##   ..$ family       : NULL
##   ..$ face         : NULL
##   ..$ colour       : NULL
##   ..$ size         : NULL
##   ..$ hjust        : num 0.5
##   ..$ vjust        : NULL
##   ..$ angle        : NULL
##   ..$ lineheight   : NULL
##   ..$ margin       : 'margin' num [1:4] 0points 2.2points 0points 2.2points
##   .. ..- attr(*, "unit")= int 8
##   ..$ debug        : NULL
##   ..$ inherit.blank: logi TRUE
##   ..- attr(*, "class")= chr [1:2] "element_text" "element"
##  $ axis.ticks                      :List of 6
##   ..$ colour       : chr "grey20"
##   ..$ linewidth    : NULL
##   ..$ linetype     : NULL
##   ..$ lineend      : NULL
##   ..$ arrow        : logi FALSE
##   ..$ inherit.blank: logi TRUE
##   ..- attr(*, "class")= chr [1:2] "element_line" "element"
##  $ axis.ticks.x                    : NULL
##  $ axis.ticks.x.top                : NULL
##  $ axis.ticks.x.bottom             : NULL
##  $ axis.ticks.y                    : NULL
##  $ axis.ticks.y.left               : NULL
##  $ axis.ticks.y.right              : NULL
##  $ axis.ticks.theta                : NULL
##  $ axis.ticks.r                    : NULL
##  $ axis.minor.ticks.x.top          : NULL
##  $ axis.minor.ticks.x.bottom       : NULL
##  $ axis.minor.ticks.y.left         : NULL
##  $ axis.minor.ticks.y.right        : NULL
##  $ axis.minor.ticks.theta          : NULL
##  $ axis.minor.ticks.r              : NULL
##  $ axis.ticks.length               : 'simpleUnit' num 2.75points
##   ..- attr(*, "unit")= int 8
##  $ axis.ticks.length.x             : NULL
##  $ axis.ticks.length.x.top         : NULL
##  $ axis.ticks.length.x.bottom      : NULL
##  $ axis.ticks.length.y             : NULL
##  $ axis.ticks.length.y.left        : NULL
##  $ axis.ticks.length.y.right       : NULL
##  $ axis.ticks.length.theta         : NULL
##  $ axis.ticks.length.r             : NULL
##  $ axis.minor.ticks.length         : 'rel' num 0.75
##  $ axis.minor.ticks.length.x       : NULL
##  $ axis.minor.ticks.length.x.top   : NULL
##  $ axis.minor.ticks.length.x.bottom: NULL
##  $ axis.minor.ticks.length.y       : NULL
##  $ axis.minor.ticks.length.y.left  : NULL
##  $ axis.minor.ticks.length.y.right : NULL
##  $ axis.minor.ticks.length.theta   : NULL
##  $ axis.minor.ticks.length.r       : NULL
##  $ axis.line                       :List of 6
##   ..$ colour       : chr "black"
##   ..$ linewidth    : 'rel' num 1
##   ..$ linetype     : NULL
##   ..$ lineend      : NULL
##   ..$ arrow        : logi FALSE
##   ..$ inherit.blank: logi TRUE
##   ..- attr(*, "class")= chr [1:2] "element_line" "element"
##  $ axis.line.x                     : NULL
##  $ axis.line.x.top                 : NULL
##  $ axis.line.x.bottom              : NULL
##  $ axis.line.y                     : NULL
##  $ axis.line.y.left                : NULL
##  $ axis.line.y.right               : NULL
##  $ axis.line.theta                 : NULL
##  $ axis.line.r                     : NULL
##  $ legend.background               :List of 5
##   ..$ fill         : NULL
##   ..$ colour       : logi NA
##   ..$ linewidth    : NULL
##   ..$ linetype     : NULL
##   ..$ inherit.blank: logi TRUE
##   ..- attr(*, "class")= chr [1:2] "element_rect" "element"
##  $ legend.margin                   : 'margin' num [1:4] 5.5points 5.5points 5.5points 5.5points
##   ..- attr(*, "unit")= int 8
##  $ legend.spacing                  : 'simpleUnit' num 11points
##   ..- attr(*, "unit")= int 8
##  $ legend.spacing.x                : NULL
##  $ legend.spacing.y                : NULL
##  $ legend.key                      : NULL
##  $ legend.key.size                 : 'simpleUnit' num 1.2lines
##   ..- attr(*, "unit")= int 3
##  $ legend.key.height               : NULL
##  $ legend.key.width                : NULL
##  $ legend.key.spacing              : 'simpleUnit' num 5.5points
##   ..- attr(*, "unit")= int 8
##  $ legend.key.spacing.x            : NULL
##  $ legend.key.spacing.y            : NULL
##  $ legend.frame                    : NULL
##  $ legend.ticks                    : NULL
##  $ legend.ticks.length             : 'rel' num 0.2
##  $ legend.axis.line                : NULL
##  $ legend.text                     :List of 11
##   ..$ family       : NULL
##   ..$ face         : NULL
##   ..$ colour       : NULL
##   ..$ size         : 'rel' num 0.8
##   ..$ hjust        : NULL
##   ..$ vjust        : NULL
##   ..$ angle        : NULL
##   ..$ lineheight   : NULL
##   ..$ margin       : NULL
##   ..$ debug        : NULL
##   ..$ inherit.blank: logi TRUE
##   ..- attr(*, "class")= chr [1:2] "element_text" "element"
##  $ legend.text.position            : NULL
##  $ legend.title                    :List of 11
##   ..$ family       : NULL
##   ..$ face         : NULL
##   ..$ colour       : NULL
##   ..$ size         : NULL
##   ..$ hjust        : num 0
##   ..$ vjust        : NULL
##   ..$ angle        : NULL
##   ..$ lineheight   : NULL
##   ..$ margin       : NULL
##   ..$ debug        : NULL
##   ..$ inherit.blank: logi TRUE
##   ..- attr(*, "class")= chr [1:2] "element_text" "element"
##  $ legend.title.position           : NULL
##  $ legend.position                 : chr "right"
##  $ legend.position.inside          : NULL
##  $ legend.direction                : NULL
##  $ legend.byrow                    : NULL
##  $ legend.justification            : chr "center"
##  $ legend.justification.top        : NULL
##  $ legend.justification.bottom     : NULL
##  $ legend.justification.left       : NULL
##  $ legend.justification.right      : NULL
##  $ legend.justification.inside     : NULL
##  $ legend.location                 : NULL
##  $ legend.box                      : NULL
##  $ legend.box.just                 : NULL
##  $ legend.box.margin               : 'margin' num [1:4] 0cm 0cm 0cm 0cm
##   ..- attr(*, "unit")= int 1
##  $ legend.box.background           : list()
##   ..- attr(*, "class")= chr [1:2] "element_blank" "element"
##  $ legend.box.spacing              : 'simpleUnit' num 11points
##   ..- attr(*, "unit")= int 8
##   [list output truncated]
##  - attr(*, "class")= chr [1:2] "theme" "gg"
##  - attr(*, "complete")= logi TRUE
##  - attr(*, "validate")= logi TRUE
Code
Code
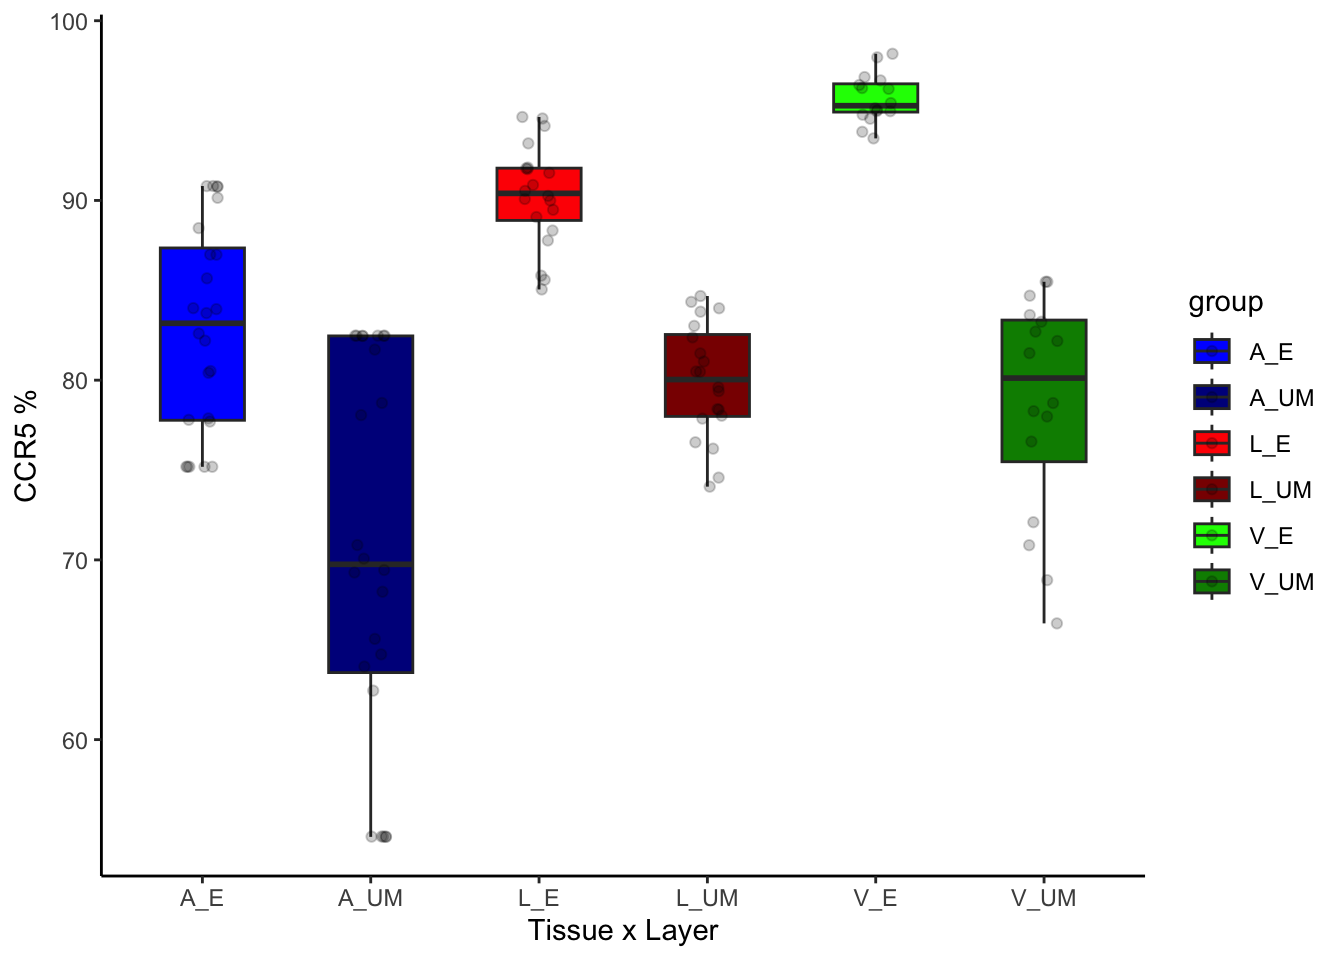
Annotating the plot
Horizontal and Vertical lines:
I’ve added vertical lines (vlines), where you can specify the xintercepts to draw lines through.
I also added “annotate” layers where you can specify “text” or “segment” layers, with x, y and label arguments for
Code
data %>%
  mutate(percent_CCR5 = 100*CCR5/CD4) %>%
  ggplot(aes(
    x = group,
    y = percent_CCR5
  ))+
  geom_boxplot(width=0.5) +
  geom_jitter(width=0.1, alpha=0.2)+
  labs( y= "CCR5 %", x= "Tissue x Layer")+
  geom_vline(xintercept = c(2,4)+.5)+
  annotate("segment",
           x=c(1:6)-.25, xend = c(1:6)+.25,
           y=data%>% mutate(percent_CCR5 = 100*CCR5/CD4) %>% group_by(group) %>% summarise(mean = mean(percent_CCR5)) %>% select(mean) %>% unlist(), color="red", size=2)+
  annotate("text",
           x=1:6,
           y=data%>% mutate(percent_CCR5 = 100*CCR5/CD4) %>% group_by(group) %>% summarise(mean = mean(percent_CCR5)) %>% select(mean) %>% unlist(),
           label = data%>% mutate(percent_CCR5 = 100*CCR5/CD4)%>%group_by(group)%>%summarise(mean=mean(percent_CCR5)) %>% select(mean) %>% unlist() %>%round(),
           hjust = -2, color="red")+
    theme_classic()
## Warning: Using `size` aesthetic for lines was deprecated in ggplot2 3.4.0.
## ℹ Please use `linewidth` instead.
## This warning is displayed once every 8 hours.
## Call `lifecycle::last_lifecycle_warnings()` to see where this warning was generated.
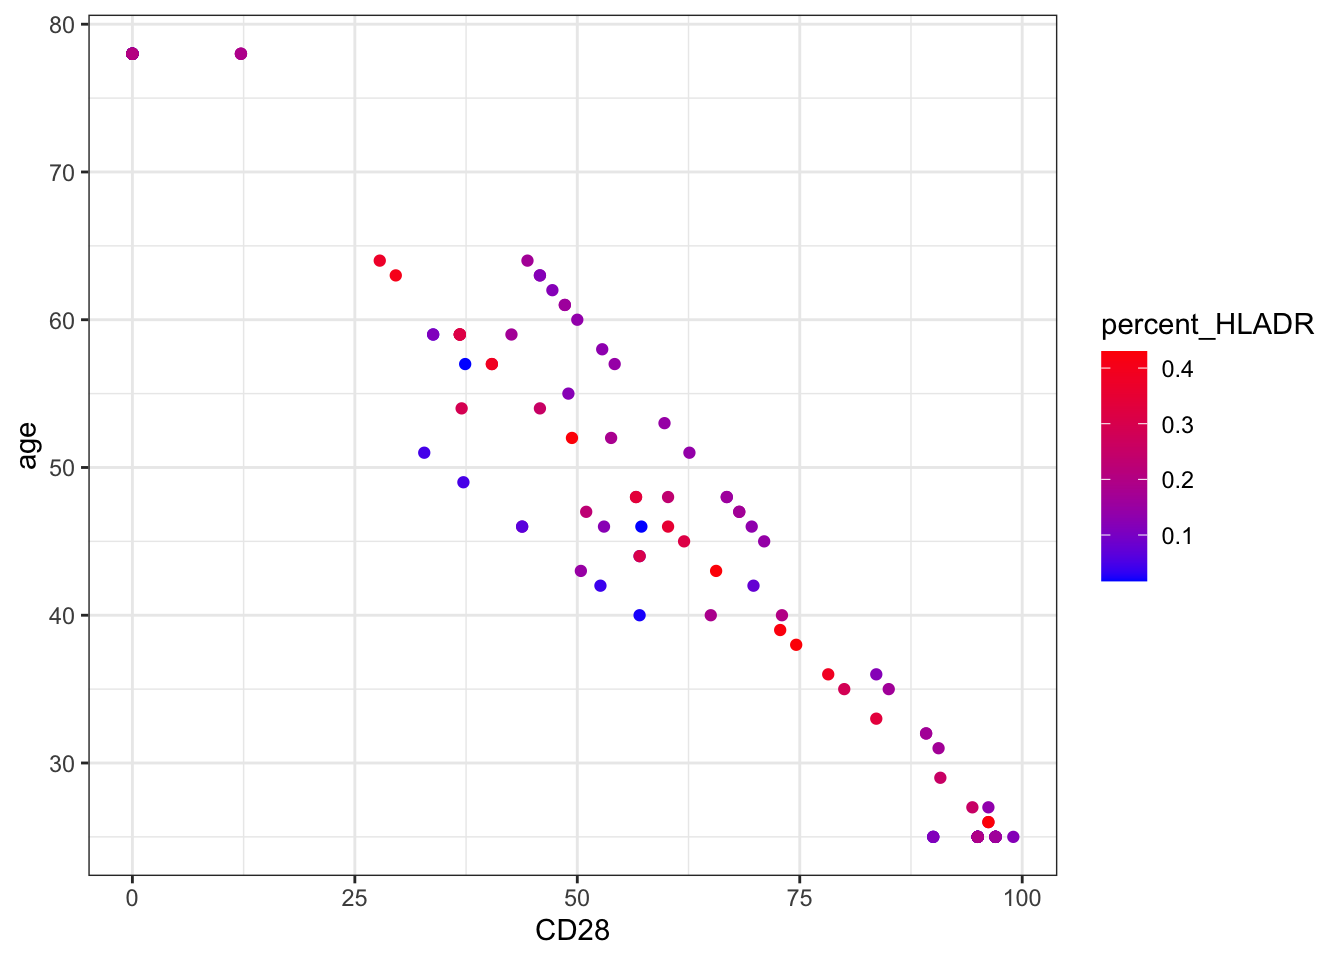
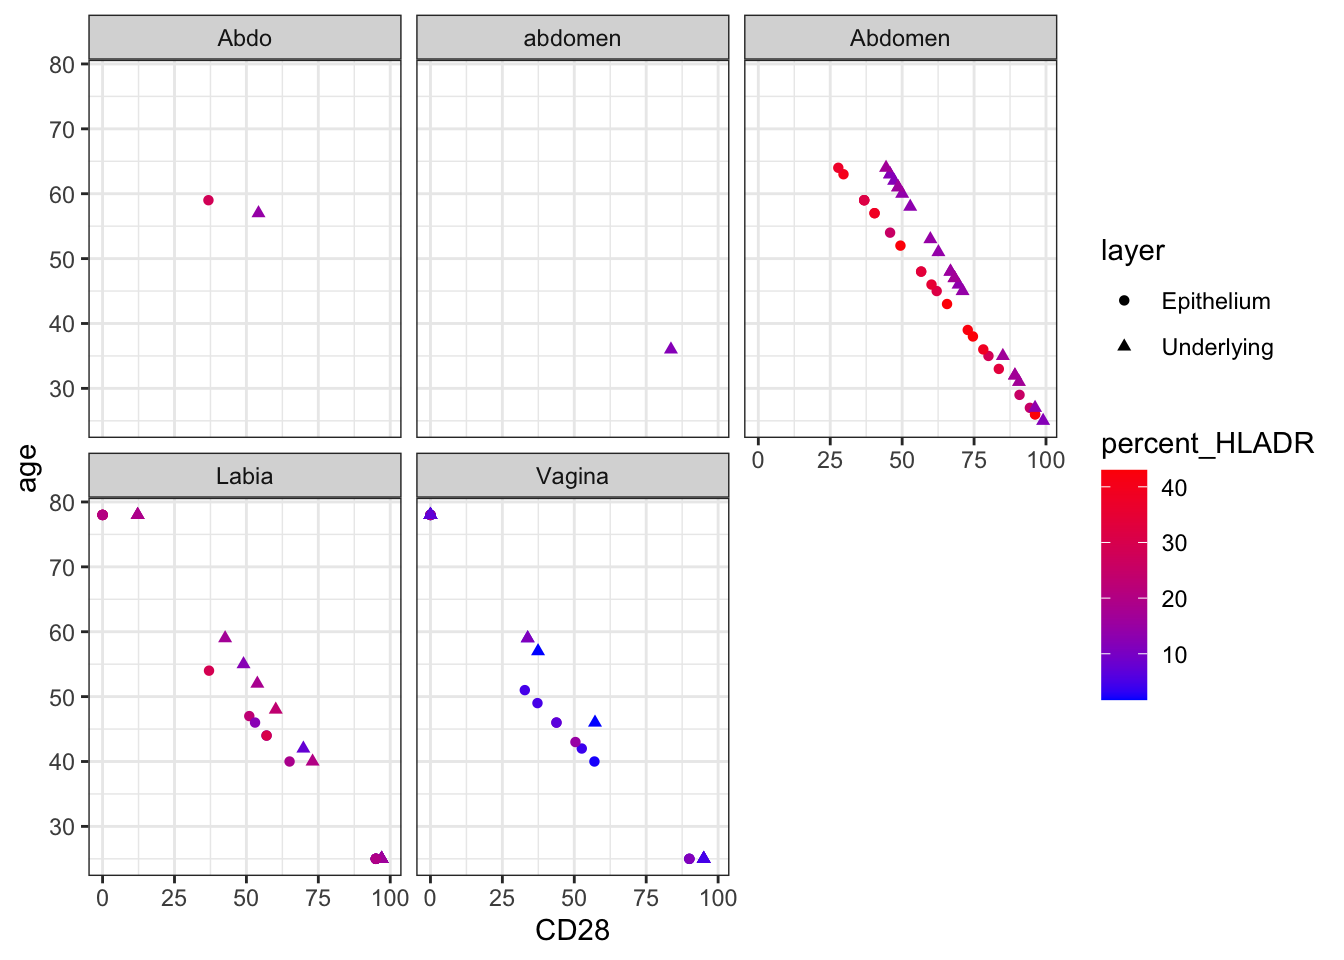
facet_wrap() and Group
Facet wrap lets you split your points by a categorical value
Facet_wrap():
Code
plot_grid():
##
## Attaching package: 'cowplot'
## The following object is masked from 'package:lubridate':
##
## stampCode
plot1 = data %>%
  mutate(percent_CCR5 = 100*CCR5/CD4) %>%
  ggplot(aes(
    x = group,
    y = percent_CCR5
  ))+
  geom_boxplot(width=0.5) +
  geom_jitter(width=0.1, alpha=0.2)+
  labs( y= "CCR5 %", x= "Tissue x Layer", title="Percent CCR5")+
  geom_vline(xintercept = c(2,4)+.5)+
  theme_classic()
plot2 = data %>%
  ggplot(aes(
    x = group,
    y = log(CCR5_MFI)
  ))+
  geom_boxplot(width=0.5) +
  geom_jitter(width=0.1, alpha=0.2)+
  labs( y= "log(CCR5 MFI)", x= "Tissue x Layer", title="CCR5 MFI")+
  geom_vline(xintercept = c(2,4)+.5)+
  theme_classic()

plot_grid(plot1,plot2, nrow=2) #or change the rows. Add 50 plots if you want to adn specify how you arrange them by rows and/or columns
Saving plots
You can save plots in a few ways.
pdf/png/tiff/jpeg():
Use ?png to get the specific options, but here is a simple example of generating a multipage pdf.
You call the function to “open” the pdf, plot your figures, and then close the pdf using dev.off()
Code
pdf(file="CCR5_results.pdf", widht = 7, height=7)

data %>%
  mutate(percent_CCR5 = 100*CCR5/CD4) %>%
  ggplot(aes(
    x = group,
    y = percent_CCR5
  ))+
  geom_boxplot(width=0.5) +
  geom_jitter(width=0.1, alpha=0.2)+
  labs( y= "CCR5 %", x= "Tissue x Layer", title="Percent CCR5")+
  geom_vline(xintercept = c(2,4)+.5)+
  theme_classic()

data %>%
  ggplot(aes(
    x = group,
    y = log(CCR5_MFI)
  ))+
  geom_boxplot(width=0.5) +
  geom_jitter(width=0.1, alpha=0.2)+
  labs( y= "log(CCR5 MFI)", x= "Tissue x Layer", title="CCR5 MFI")+
  geom_vline(xintercept = c(2,4)+.5)+
  theme_classic()

dev.off()
ggsave:
ggsave is quite simple and allows you to very easily control resolutions and size.
Code